THE STATISTICS OF ROAD ACCIDENT IN MALAYSIA

TABLE OF CONTENTS
PART 01
-
GROUP DETAILS
PART 02
-
INTRODUCTION
PART 03
-
DATA ANALYTICS INTERPRETATION
-
DISCUSSION
-
CONCLUSION
GROUP DETAILS
_edited.jpg)
Noor Hannani (Leader)

Lee Rong Xian
Data research

Ain Batrisyia
Assistant Manager

Muhamad Akmal
Programming Editor

Siti Nurkamilah
Art Director
Data Analysis & Visualation and Design the Graph
Data Research & Analysis
Working on Introduction
Website Creator & Conclusion
Discussion of Results
INTRODUCTION
Trends of Data Analytics in Different Sectors
Data Analytics could be a process of analyzing raw datasets to derive a conclusion regarding the data they hold. Data analytics processes and techniques use applications that operate on machine learning algorithms, simulation, and automatic systems. They help organizations understand their clients better, analyze their promotional campaigns, customize the content, create content strategies, and expand products. There are many different sectors that make use of data analytics. Some of them are banking and securities, communications and media, healthcare, and education. For banking and securities, they use big data analytic to monitor financial markets through network activity monitors and natural language processors to make sure there aren’t any fraudulent transactions and illegal trading happens. While communications and media use real-time reportage of worldwide events on several platforms like mobile, web, and TV at once. Next is healthcare where they use data analytic to gather public health data for faster responses to individual health problems and identify the global spread of new virus strains. For education, universities around the globe are using data analytic to monitor and track the performance of their students and faculties and survey the interest of students in different subjects via attendance.
Reflection
Based on the research conducted, data analytics plays a vital role in the business. The importance of data analysis in any sector is added, creating a very large quantity of knowledge that may provide useful insights into the field. Data analytics consists of descriptive, predictive, diagnostic, and prescriptive analytics. Analytics data brings more benefits to the business as it is an essential asset for companies for obtaining a competitive advantage. Perhaps we can look at how Amazon, for example, uses the opportunities provided by big data analytics to understand and know their customers inside out. It is best to make good use of data analytics to gain more advantages and to ensure we are not left far behind our business rival.
Microsoft Power BI
Microsoft Power BI is a collection of software services, apps, and connectors that work together to turn any unrelated sources of data into coherent, visually immersive, and interactive insights. Power BI makes it easy to connect to the data sources, clean, and transform the data into a data model without affecting the underlying source and visualize what's important, and can be shared with other users in the organization. There are 3 views available which can be selected on the left side of the canvas. The first one is the report site, where users create reports and visuals. The next one is the data site, where there are tables and other data associated with the report. The last one is the model site, where users can create and manage table relationships. In Power BI, there are many different types of data sources available. Power BI Desktop has a Get Data button on the home tab. When users click on it, it will show many categories to which Power BI can connect. Select a source to establish a connection. Depending on the selection, users will be asked to find the source on their computer or network and start building a report. Publish the report from Power BI Desktop to Power BI Service and share it so the business user in the Power BI Service can view and interact with the report.
When to use Power BI
The analytical tool that is used most is Excel. Many people still use Excel to organize data and perform financial analysis. However, Power BI is better when it comes to creating reports and sharing them throughout an organization because it is quite hard and needs more work to perform using Excel spreadsheets by extracting data to create reports. Therefore, Power BI is more flexible to transform and visualize the data.
Data Visualization
How to do data visualization using Microsoft Power BI? Firstly, find the story in the data. Information can be visualized in several ways, where each of them can provide a specific insight. It is important to identify and understand the story that is to be delivered. Make a proper visualization to make sure the message is delivered in the best way. Next, know the data. Before understanding visualizations, understand first what types of data can be visualized and their relationships to each other. There are 4 types of data which are quantitative, discrete, continuous, and categorical while the relationship consists of nominal comparison, time series, correlation, ranking, deviation, distribution, and part-to-whole relationships. Create a data model first. Then after having a data model, drag fields onto the report canvas to create visuals.
Reflection
Throughout this industrial talk, we get to know how to use Microsoft Power BI and how to visualize data. Power BI is easy to use and is like a smarter solution to produce reliable reports and analysis via dashboards, reports, and datasets. Moreover, Power BI is something important that anyone who wants to dive into the business world because of its simplicity and user-friendly. Power BI is also available on all platforms and can be used at any time, so we can easily access data and information, while don’t have to worry about its safety as it is protected. Visualization data is also included in the Power BI. It is to make sure that the patterns and errors in the data can be recognized so that the users can pay attention to the areas that indicate the progress. To conclude, this technology can help to improve the operations and performances of any business.
DATA ANALYTICS INTERPRETATION

DESCRIPTIVE ANALYSIS
-
90% of organizations today use descriptive analytics which is the most basic form of analytics.
-
. This type of analytics, analyses the data coming in real-time and historical data for insights on how to approach the future.
-
The main objective of descriptive analytics is to find out the reasons behind precious success or failure in the past.
-
Descriptive analytics are based on standard aggregate functions in databases, which just require knowledge of basic school math.

Year
From 2018 until 2021
road accident cases
Road accident that recorded in Malaysia
States
There are 14 states in Malaysia
death cases
Death cases that was recorded since 2018
VARIABLE TRANSFORMATION
GRAPH & CHART
This chart shows the percentage of road accident cases in every state

This graph shows the total number of road accident from every state

This graph shows the number of road accident cases from 2018 until 2021

This graph shows the total number of death cases from 2018 until 2021
DISCUSSION
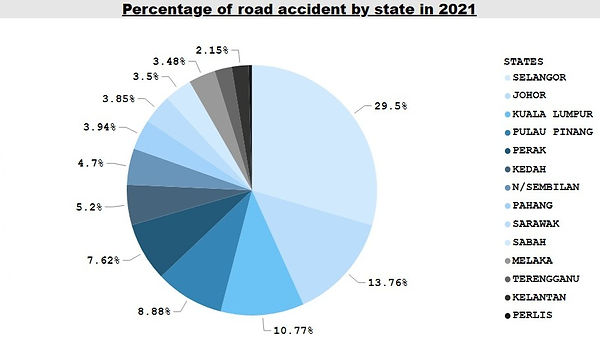
Percentage of road accident by state in 2021
This pie chart shows the percentage of road accident by state in year 2021. States involved are Selangor, Johor, Kuala Lumpur, Pulau Pinang, Perak, Kedah, Negeri Sembilan, Pahang, Sarawak, Sabah, Melaka, and Terengganu, Perlis, and Kelantan. From the pie chart it is clear that the largest portion of road accidents happened in Selangor (29.5%) with 15.74% difference between the two that is Johor. The third highest is Kuala Lumpur with 10.77% followed by Pulau Pinang (8.88%), Perak (7.62%), Kedah (5.2%), Negeri Sembilan (4.7%), Pahang (3.94%), Sarawak (3.85%), Sabah (3.5%), Melaka (3.48%), Terengganu (2.22%). The second lowest is Kelantan with 2.15%. Lastly, only 0.44% of road accidents happen in Perlis.
Number of road accident by state in 2021
The bar cart illustrates the number of road accident by state Selangor, Johor, Kuala Lumpur, Pulau Pinang, Perak, Kedah, Negeri Sembilan, Pahang, Sarawak, Sabah, Melaka, Terengganu, Kelantan, and Perlis in year 2021.From the chart, it shows that the number of road accident cases in Selangor is the highest with 60 370 cases. Johor is the state with the second highest number of road accidents with 28 157 cases. Next, Kula Lumpur slightly lower than Johor with 22 037 cases followed by Pulau Pinang (18 166), Perak (15 590), Kedah (10 632), Negeri Sembilan (9 611), Pahang (8 071), Sarawak (7 883), Sabah (7 159), Melaka (7 130), Terengganu (4 539), and Kelantan (4 403). The lowest number of road accident cases in 2021 is Perlis with only 905 cases recorded.
Total number of road accidents from 2018 to 2021 in Malaysia
The graph indicates the total number of road accidents recorded in Malaysia between the year 2018 to 2021. The number of road accidents reported slightly increased from 548 598 cases in 2018 to 567 516 cases in 2019. The total number of road accidents constantly decreased from 2019 to 2021. The number of cases in 2020 is 418 237 and dropped to 204 653 in 2021.
Total number of death cases from 2018 to 2021
The graph illustrates the total number of deaths due to road accidents from the year 2018 to 2021 in Malaysia. The number of death cases due to road accidents increased significantly from 3 000 cases in 2018 to 6 200 cases in 2019. Then, the number of death cases reported decreased to 4 600 cases in 2020. Lastly, the number of death cases due to road accidents dropped from 4 600 cases in 2020 to 2 600 cases in 2021.
CONCLUSION
In brief, we can see the highest percentage of road accident cases is in Selangor. It is because Selangor has the largest population as compared to other states in Malaysia. Futhermore, Perlis has the lowest number of road accident cases reported as compared to other states due to its smallest population. The number of road accident cases in every state is expected to increase in future. In addition, we can see the significantly decreased number of cases in 2019 to 2021 because of the pandemic of Covid 19 and the government started to implement lockdown to prevent the spread of Covid 19. Last but not least, the number of death cases reported in Malaysia decreased from 2019 to 2021 due to the decreased number of car accidents. It is because the number of cars on the road is reduced as the lockdown has been implemented by the government due to the pandemic of Covid 19.